
By: David Stockman
The flyover zones of America are wanting for work and buried in debt. That’s the legacy of three decades of Washington/Wall Street Bubble Finance. The latter has exported jobs, crushed the purchasing power of main street wages and showered the bicoastal elites with the windfalls of financialization.
The graph below depicts the main street side of this great societal swindle at work. There are currently 126 million prime working age persons in the US between 25 and 54 years of age. That’s up from 121 million at the beginning of 2000.
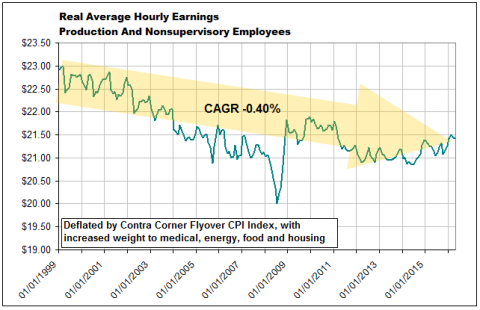
Yet even as this business cycle is rolling over, the 77.1 million employed full-time from that pool is still 1.2 million below its turn of the century level and accounts for only 61% of the population. On top of that, average real hourly wages have fallen by 7% (based on the Flyover CPI), as well.
It might be wondered, therefore, as to how real consumption expenditures rose by $3.1 trillion or 38% during the same 16-year period?
The short answer is transfer payments and debt, and those troublesome realities go right to the economic blind spots of our Keynesian monetary suzerains. These paint-by-the-numbers economic plumbers care only about the great aggregates of spending and whether or not the bathtub of so-called “full employment GDP” is being filled to the brim.
As a consequence, the ideas of quality, sustainability, efficiency, discipline, prudence or, for that matter, even economic justice and equity, never enter the narrative. It matters not a wit whether the considerable expansion of PCE depicted above originated in disability checks, second mortgages, car loans at 120% loan-to-value—-or even if it was deposited by a passing comet.
What counts is the incremental gains in GDP compared to last quarter and proxies for demand such as job counts and housing starts versus prior month. And when the business cycle eventually ends, there is always a scape-goat to blame, such as an oil price shock or Wall Street meltdown.
By contrast, no Fed head ever asked whether real PCE growth of nearly two-fifths during a period when the number of prime-age full-time workers went down and real wage rates dropped was healthy or sustainable.
Likewise, the powered-obsessed denizens of the Eccles Building never question their inflation short stick (the PCE deflator less food and energy). After all, it gives them the green light to keep on pumping money into Wall Street on the misbegotten theory that this will indirectly stimulate main street (i.e. the wealth effect).
But as we have shown, the actual cost of living inflation faced by main street households has averaged 3.1% per year since 2000, meaning that the purchasing power of hourly wages has dropped by 7%. And average weekly hours have fallen, too, owing to the declining quality of the jobs mix.
Yes, the number of part time workers has rising modestly and, as we have shown, the participation rate of Wal-Mart greeters among the over 65 cohort has risen steadily. But the fact remains that on the margin the 38% real gain in consumer spending shown above was funded from sources other than pay envelopes.
Not surprisingly, government transfer payments played a major role in funding the nation’s shopping cart, even as wages and salaries lagged. But this represented a double-edged sword that is completely ignored by the Wall Street/Washington peddlers of consumption based economics.
During the last 16 years, in fact, government transfer payments have grown at 6.2% annually or by nearly 2Xthe 3.3% growth of nominal wage and salary disbursements. As shown in the chart, transfer payments soared by $1.7 trillion during the period—-a figure which amounted to nearly 50% of the growth of wages and salaries.
As a result, transfer payments went from 21.5% of wage and salary income at the turn of the century to 33.2%during April 2016. The point, of course, is that this huge incremental fiscal burden must be funded with higher taxes today or increased public debt, which amounts to higher taxes tomorrow.
Nor can obliviousness to the supply-side impact of the Fed’s consumptionist economic model be dismissed as a problem for the distant future—– even if stealing from unborn generations was an appropriate public policy. The fact is, jobs and living standards in the flyover zones are already being crushed by what might be termed the “pincer economics” of the Fed’s inflationist policies.
One the one hand, financial repression, cheap debt and the Fed’s 2% inflation target have forced-up the domestic price level, pushing nominal wages far higher than would have been the case under sound money and market set interest rates. Accordingly, domestic production and jobs on the margin have been lost to the China Price for goods and the India Price for services.
At the same time, heavy payroll and income tax withholdings from these inflated wage levels has further depressed employer competitiveness and the real purchasing power of after-tax paychecks.
In sum, Wall Street loves financial repression because it inflates financial asset values and fuels debt-funded gambling in the casinos. But it’s the opposite of what’s needed in flyover America.
Unless Trump wants to build an economic Wall around the entirety of the US economy, what is actually needed on main street is a falling CPI and taxes on consumption, not today’s burdensome levies on payrolls and production.
Needless to say, our monetary central planners are not concerned with supply-side impediments to growth. Nor are they bothered by the implications of an open economy for nominal wages rates in a world where the labor supply curve has been shifted drastically lower.
Their Keynesian economic model, in effect, holds that any spending will do. In fact, the whole purpose of interest rate repression is to induce households and businesses to leverage-up and spend at rates higher than warranted by current incomes and cash flows.
Accordingly, another big share of the income/spending gap has been back-filled with debt—especially prior to the financial crisis. During the two decades after 1987, household debt erupted by nearly 7X. Even after the year 2000, household debt grew by nearly $7.5 trillion or more than double the $3.4 trillion gain in nominal personal consumption expenditure.
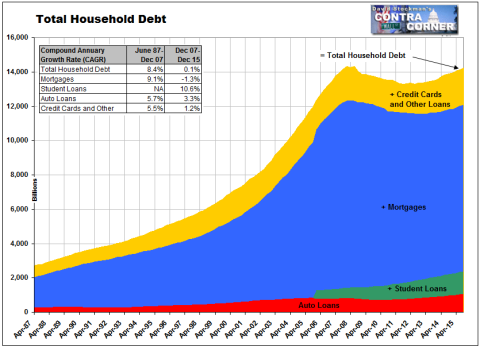
To be sure, total household debt has plateaued since the financial crisis owing to the arrival of Peak Debt. But that has not completely closed all the doors to debt funded consumption. As suggested by the above chart, in fact, the operative theory of Fed policy is that no balance sheet space should go unleveraged.
Accordingly, the trillion dollar reduction in mortgage debt since 2007 has been backfilled by an upsurge in student loans and auto credit. And in the case of the latter, the strong rebound in auto sales since the mid-2010 cyclical bottom has been all about debt.
Since then, retail motor vehicle sales have risen from $740 billion to an annualized rate of about $1.1 trillion in the most recent month. But there is no mystery about the funding source for this rebound. To wit, the $360 billion gain in auto sales over the last six years is matched almost exactly by a $350 billion rise in auto loans outstanding.
Stated differently, almost anyone who can fog a rearview mirror has now gotten a car loan or lease. Yet never once has the FOMC cautioned that automotive sector production and jobs are actually being put in harm’s way by its ultra-cheap debt policy.
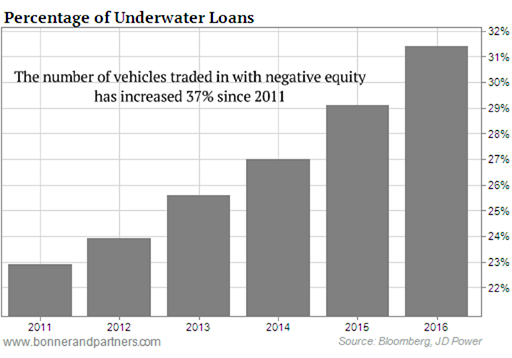
But here is a data point far more significant than the trivialities about short-run economic conditions that populate the Fed’s meeting statements. To wit, nearly one-third of vehicle trade-ins are now carrying negative equity.
That means that prospective new car buyers are having to stump-up increasing amounts of cash to pay-off old loans, which, in turn, is pressuring volume-hungry lenders and dealers to extend loan-to-value ratios to even more absurd heights than the 120% level now prevalent. That’s kicking the metal down the road with a vengeance.
In fact, outstanding subprime auto debt is nearly 3Xhigher than it was on the eve of the financial crisis and average loan terms at nearly 70 months are a ticking time bomb. That’s because cars depreciate faster than loan balances can be paid down over that extended duration, meaning more and more of outstanding auto credit will be under water in the future.
And that’s the skunk in the woodpile. With today’s technology auto loans are supposed to be inherently low-risk. If push-comes-to-shove the repo man can find cars anywhere in America and tow them back to the lender for re-sale.
But this assumes that used car prices will remain at current levels, and that’s the catch. The coming tidal wave of vehicles coming off lease is fixing to send the used car market and the whole trillion dollar auto financing system into a tailspin during the next four years.
Needless to say, ground zero for the great auto repo rampage ahead will be the flyover zones of America.

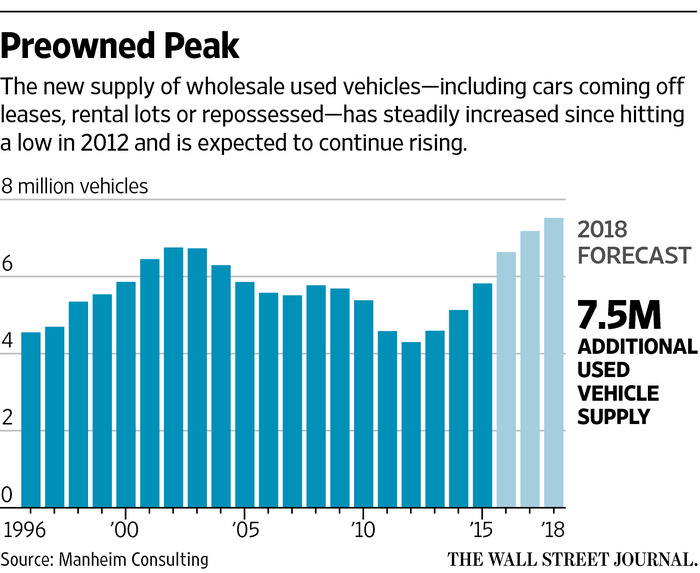
Indeed, payback time is already peeking just around the corner. The virtuous cycle of declining used car generation and rising used car prices has exhausted itself. Yet that was crucial to the debt financed car-buying spree because it meant rising trade-in prices and therefore enhanced capacity to make down payments and loan terms.
Thus, in the run-up to the new auto sales crash in 2008-2009, used car prices plunged by 20% and new light vehicle sales fell from an 18 million annual rate to barely 10 million at the bottom of the cycle.
By contrast, during the first three years of the post-June 2009 recovery, used car prices soared by 24%, enabling the credit fueled recovery of new vehicle sales shown in the graph.
The worm is now fixing to turn because the used car market is facing an unprecedented tsunami of used vehicles coming off loans, leases, rental fleets and repossessions. As shown above, used vehicle prices have been weakening for the last several years, but between 2016 and 2018 upwards of 21 million vehicles will hit the used car market compared to just 15 million during the last three years.
This means used car prices are likely to enter another swoon like 2006-2008, causing trade-in values to plummet and thereby draining the pool of qualified new car borrowers. When the cycle turns down, fogging a rearview mirror is never enough.
To be sure, there is nothing very profound about the certainty that an auto credit boom always creates a morning after hangover, and that the amplitudes of these cycles is getting increasingly violent owing to the underlying deterioration of auto credit. Currently, credit scores are dropping rapidly and upwards of 80% of new retail auto sales are loan or lease financed.
Moreover, the race to the bottom is happening once again in the lease market. That is, monthly lease rates have gotten so ridiculously cheap that the implied residual values are at all time highs. This means that when the used car pricing down-cycle sets in during the flood of vehicles ahead, massive losses will be generated, causing a sharp contraction of the leasing market, as well.
Stated differently, the auto sales piece of retail sales has virtually nothing to do with a rebounding consumer. Its a reflection of an artificially bloated and unstable credit cycle that is about ready to take the plunge, and thereby deliver another blow to the faltering economics of the flyover zones.
Losing Ground In Flyover America——Wanting For Work, Buried In Debt, Part 4