The last time the labor-participation rate was as low as June 2015 was almost 40 years ago. Who was working and where back then?
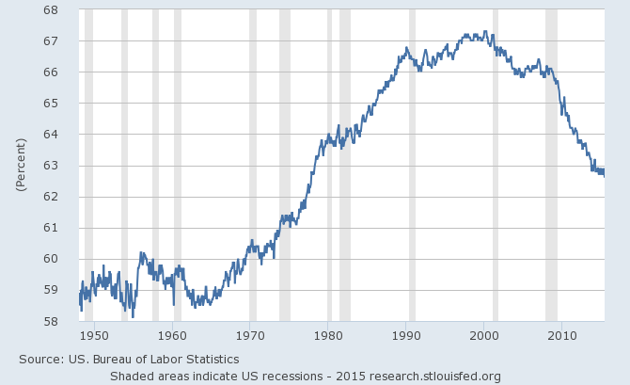
The more concerning signs are hidden beneath the surface. Some people have been sounding the alarm about labor-participation rates for years now—Republicans tried, mostly unsuccessfully, to make them an issue in the 2012 election. But as several analysts have pointed out, the June rate of 62.6 percent is the lowest since October of 1977. The decline is part of a long-term trend, as this graph shows:
Workforce Participation, 1945-Present

You can watch the status of women in the workplace change over that arc—as more and more women enter the workforce, the amount climbs and climbs. But overall participation has been declining since the tech bubble burst around 2000.
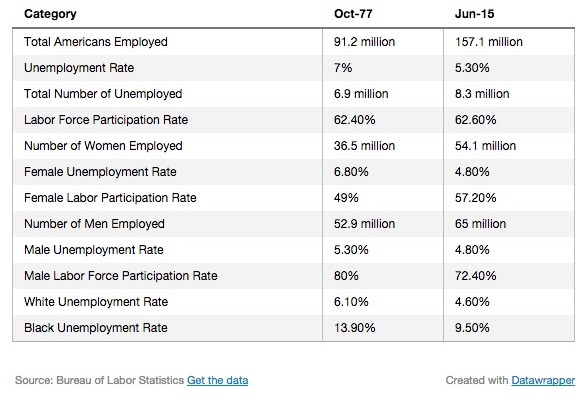
Working in America: October 1977 vs. June 2015

A couple things jump out here: Even though the labor-participation rate is almost as low now as it was then, the workforce has grown faster than the population (which was 220 million then and is around 319 million now). The big jump is in the number of women employed—from 36.5 million in October 1977 to 54.1 now. Male employment has also climbed, but not as much. So as the female labor-force participation rate has climbed, the male rate has dropped, from eight in 10 to barely seven in 10 men working full time. And whereas the male unemployment rate was much lower in 1977, now there’s gender parity.
Even as the gender balance has shifted, it’s noticeable that the racial balance hasn’t. Now, as in 1977, the black unemployment rate is much higher than the national rate, and lags far behind white unemployment.
This isn’t all just evidence of a bad economy—much of the decline comes from Baby Boomers reaching retirement age and checking out, though some of it comes from would-be workers who simply can’t find work, and millions more Americans are underemployed. That isn’t without challenges: An aging population could draw more in benefits than the government collects in social-security taxes. Massive spending on health care for older Americans could be a drag, too.
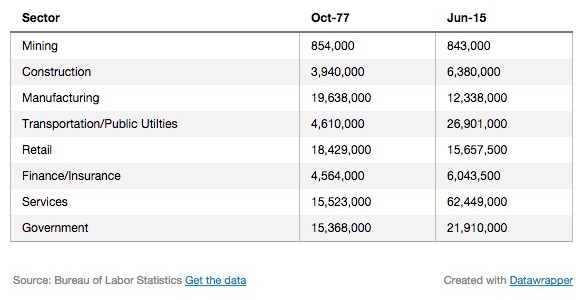
Where America Works: October 1977 vs. June 2015

The United States in 1977 was a far more manufacturing- and retail-dominated economy. Both of those sectors have contracted significantly since then. Construction is up, a bit; transportation and public utilities have grown the most by percentage. But the big difference is in the service sector, which has exploded from around 15.5 million in October 1977 to almost 62.5 million today. Unfortunately, the BLS data from 1977 doesn’t break out the health sector, but one of the fastest-growing areas of today’s U.S. economy is health-care jobs. Given all those Boomers who are retiring, dragging down the labor-participation rate, and entering their senior years, that should come as no surprise.
https://www.theatlantic.com/business/archive/2015/07/october-1977-labor-force-participation/397595/


